Near-Real-Time EVMS

The proof of integration: near-real-time EVMS.

Many companies say they integrate BIM. Very few can show it. EVMS cannot stay current unless scope, quantity, cost, schedule and progress are genuinely connected — so when it does, the integration underneath is no longer a claim. It is something you can see.

Why EVMS is the test

The arithmetic is easy. The inputs live in five places.

Earned value compares what should be done, what is done and what it cost. The formulas have been established for decades. What makes EVMS hard is that its inputs come from systems that were never built to agree with each other.

Scopelives in the design and the model
Quantitylives in the takeoff
Budgetlives in the estimate and BOQ
Dateslives in the schedule
Progresslives in field reports

Before an index can be calculated, someone has to gather all five and agree that they describe the same work. Work packages, cost codes and activities rarely line up one-to-one, so that mapping is rebuilt by hand every cycle — and again after every change. That is why EVMS is usually monthly, and why it usually looks backwards.

So EVMS is an honest test. It only stays current if the integration is real all the way through — partial integration shows up as stale numbers.
Why METOMOS can do it

The connection EVMS needs is created when the data is produced — not reconstructed every month.

01

Connected from production, not mapped afterwards

BIM, quantity, BOQ, cost and schedule are produced by the Foundry around the same engineering objects. Each cost item and each activity already knows which objects it belongs to — the relationship is created with the data, not reconstructed from five finished files.

02

One object identity across every view

The wall in the model, the line in the BOQ, the activity in the schedule and the progress record in the field refer to the same thing. That is what lets planned value, earned value and actual cost be compared without someone first agreeing that they describe the same work.

03

Progress and change update the same state

When progress is recorded or a verified design change arrives, the affected quantities, costs and activities are identified and recalculated against that one state. The indices follow — instead of waiting for the next month's reconciliation.

04

Verification and evidence travel with the numbers

Exceptions go to trained Metomers and responsible engineers. Every figure keeps its source, version and approval, so a CPI can be traced back to the objects, quantities and costs that produced it.

This is why EVMS is not an add-on module bolted onto METOMOS. It is what the Foundry's connected engineering state looks like when you measure it.

Two views of the same data

One project. Same data. Two ways to see the truth.

01

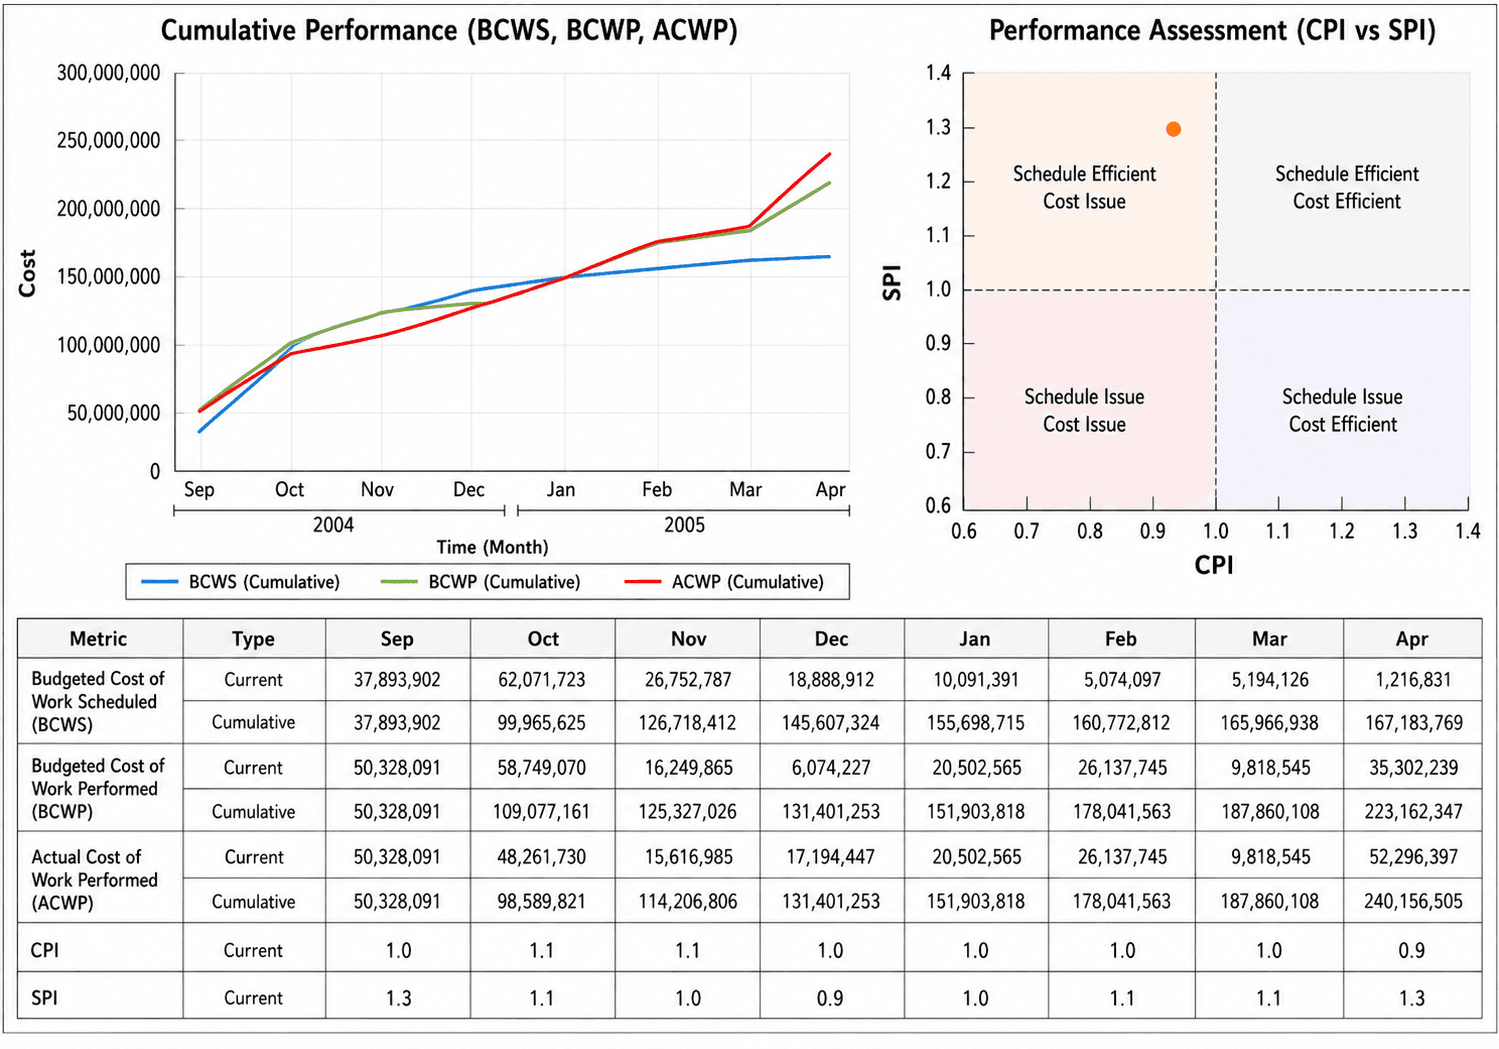
CPI / SPI — numerical project performance

Planned value, earned value and actual cost over time, the cost and schedule indices they produce, and where the project is heading at completion.

PV
Planned Value · BCWS
The budgeted value of the work that should be finished by the status date.
EV
Earned Value · BCWP
The budgeted value of the work actually finished.
AC
Actual Cost · ACWP
What that finished work actually cost.
SPI
Schedule Performance Index
EV ÷ PV. Below 1.0 means behind plan.
CPI
Cost Performance Index
EV ÷ AC. Below 1.0 means the work is costing more than it is worth.
EAC
Estimate at Completion
Where cost is heading if current performance continues.
An EVMS report: cumulative BCWS, BCWP and ACWP curves over eight months, a CPI-versus-SPI quadrant chart, and the monthly figures beneath them.
The numerical view: curves, position and the monthly figures underneath.
02

4D planned vs actual — visual project performance

Choose a date. The 3D BIM shows the building as it should stand on that day beside the building as it actually stands. The same picture answers the questions the numbers raise.

01

What should exist today?

02

What actually exists today?

03

Which areas are ahead, and which are behind?

04

What does that mean for schedule and cost?

Why two views are the proof

If any link were partial, the two views would disagree.

A CPI below 1.0 should correspond to visible areas in the 3D model where work cost more than it earned. An SPI below 1.0 should correspond to areas standing behind the planned state on that date. When the numbers and the picture agree — date after date, change after change — BIM, schedule, cost and progress are demonstrably one dataset. That agreement is not a dashboard feature. It is the integration, made visible.

What changes

From a monthly report to an instrument you steer with.

Fragmented project dataOne engineering state
Reporting cycleMonthlyAs progress and changes arrive
Mapping between scope, cost and scheduleRebuilt by hand each cycleExists from production
After a design changeRe-gather, re-map, re-reportAffected figures recalculated, then verified
What the numbers describeA project state that has already moved onThe current verified state
Where a figure came fromReconstructed from emails and spreadsheetsTraceable to objects, versions and approvals
What EVMS is used forA reporting obligationAn instrument to steer with

Who it is for

Performance information while there is still time to act on it.

Owners & developers

Cost and schedule risk while there is still time to act on it, with the 3D state that explains it.

Contractors

Which areas are behind and what that is costing — this week, not next month.

PM / CM & project controls

Forecasts built on current, traceable data instead of a monthly reconciliation exercise.

Lenders & investors

Progress and cost performance that can be checked against the engineering state behind them.

Metom EVMS and Metom 4D Simulator are working software programs whose visual interfaces are being modernized. How “near-real-time” a project runs depends on how often progress is captured, which is agreed per project; integration with existing scheduling, ERP and PMIS data is defined by project scope.

See it on one of your own projects.